Overview
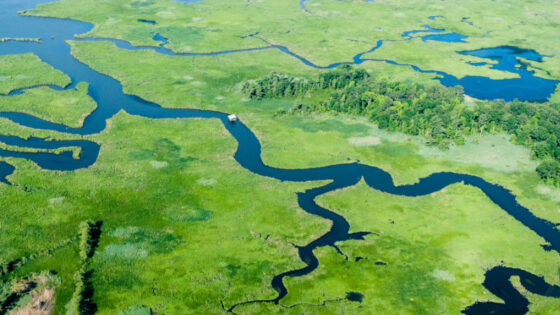
In 2000 Stroud Water Research Center was awarded a Safe Drinking Water Act (SDWA) grant funded by the New York State Department of Environmental Conservation and the USEPA to conduct a six-year study to monitor and evaluate water quality and sources of pollution in the streams, rivers, and reservoirs that provide New York City’s (NYC) drinking water. The NYC drinking water supply and infrastructure are monitored, maintained, and improved by NYC’s Department of Environmental Protection. The SDWA is the main federal law (administrated by the USEPA) that ensures the quality of America’s drinking water.
This monitoring program involved analyzing specific physical, chemical, and biological indicators to measure, quantify, and determine sources and impacts of contaminants throughout these watersheds. The project was designed to enhance on-going monitoring projects and to provide an additional baseline of information useful in such aspects as measuring changes in water quality in response to changes in land cover/use and the implementation of best management practices (BMP) for mitigating both point and non-point source pollution. The project focused on ecosystem impairment (e.g., differences in stream community structure and stream/reservoir productivity, levels of nutrient processing or sequestering) and contaminant sources (e.g., point sources such as wastewater treatment plants and non-point sources such as agricultural fields).
Objectives and Design
The principal objectives of the New York Project were to:
- Measure specific environmental variables that statistically relate aquatic ecosystem structure and function to land use, BMP implementation, and other watershed inputs or factors.
- Measure chemical, physical, and biological factors that can be used to evaluate or indicate the occurrence and/or source of selected chemical and biological aquatic contaminants.
- Provide a baseline data set of biological indicators and ecosystem-level variables and for assessing water quality improvements and aquatic ecosystem responses resulting from on-going and historical land cover/use change, BMP implementation, restorations, and mitigations.
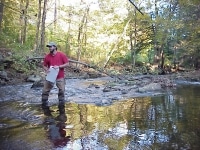
The project was designed as a six-year study (2000-2005) divided into two distinct three-year phases. Sixty stream sampling stations distributed among the major sub-basins of the principal source watersheds (East of Hudson River, EOH, and West of Hudson River, WOH) in Phase I. The 60 sampling stations were designated as either a “targeted” (n=50) or “integrative” (n=10) sampling site depending on the location in the watershed and type and intensity of variables being measured. Targeted stations occurred throughout the watersheds on streams of varying sizes. Integrative stations occur sufficiently downstream to integrate the effects of land use and other factors on a given project element or task under study over a large portion of the watershed.
Site selection criterion was to capture the range in land covers/uses across geologic and soil characteristics of all NYC source watersheds. Secondary site selection criteria included ongoing or future BMP implementation, presence of U.S. Geologic Survey (USGS) stream gaging stations, and the feasibility of studying the various study components. Sampling stations on eight reservoirs were also established in Phase I.
Phase II (2003-2005) of the project established 48 new (differing from Phase I) stream sites and four new reservoir sites. Twelve of the Phase I stream sites and three existing reservoir sites were retained to maintain continuity between phases and provide a measure of inter-annual variability. Phase II work builds upon Phase I results by sampling other important tributaries and focusing sampling effort to refine any ambiguous results from the Phase I effort.
The project is designed as a broad synoptic survey repeated annually, rather than as a highly targeted, spatially narrow survey with a high degree of repetition in each year of study. Sampling is conducted primarily in the late spring, summer, and early fall; however, winter sampling is conducted as part of one study task.
Components
Nutrients and Major Ions in Transport
Nutients and major ions in transport were monitored during summer baseflow and during stormflows. Major ions include cations (i.e., sodium, magnesium, calcium, and potassium), and anions (i.e., sulfate, chloride). Nutrients include various forms of nitrogen and phosphorus. pH, alkalinity, and conductivity are also measured at the study sites.
For a complete description of all nutrient/ion methodologies, data analyses, results, literature cited, and interpretations please see Chapter 3 in the final report.
Molecular Tracers
Molecular tracers are a broad group of compounds present in the aquatic environment that are unique to various contaminant sources. The use of such tracers is an emerging technique that qualitatively links the presence of a particular contaminant in a stream or river to a specific source of that contamination within the upstream watershed. Tracers are measured during summer and winter baseflow and during stormflows and include: fragrances found in domestic products (e.g.,detergents) and caffeine, which are used to indicate the presence of waste water treatment plant (WWTP) or septic effluent; fecal steroids, which track animal (farm or wildlife) and human contamination; and polycyclic aromatic hydrocarbons (PAH), which target urban/suburban sources of contamination.
For a complete description of all tracer methodologies, data analyses, results, literature cited, and interpretations please see Chapter 4 in the final report.
Macroinvertebrate Community Structure
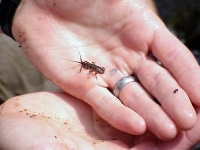 Macroinvertebrate community structure provides an integrated (over time) measure of water quality conditions. Stream dwelling invertebrates were collected at the 60 stream sites during spring baseflow. Benthic macroinvertebrates, such as insects, worms, and molluscs, provide an extended temporal perspective (relative to the molecular tracer, major ions and nutrient sampling performed periodically) because they have limited mobility and relatively long life spans . Macroinvertebrates have measurable responses to a wide variety of environmental changes and stresses that can be easily analyzed, and they are an important link in the aquatic food web.
For a complete description of all macroinvertebrate methodologies, data analyses, results, literature cited, and interpretations please see Chapter 7 in the final report.
Organic Particles (Suspended Solids) in Transport
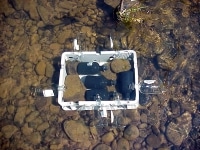
Organic particles in transport are indicative of the ability of a stream ecosystem to process organic matter, provide a link between the upstream generation and downstream transfer of organic energy, and provide an estimate of the carbon loading to downstream reservoirs. The concentration, size distribution, and transport of organic particles were sampled under baseflow conditions and, to estimate response of organic particle transport to runoff events, during stormflow.
For a complete description of all organic matter transport methodologies, data analyses, results, literature cited, and interpretations please see Chapter 6 in the final report.
DOC and BDOC Dynamics
 Dissolved organic carbon (DOC) is an indicator of organic loadings to streams, as well as terrestrial processing (e.g., within the soil, forests, and wetlands) of organic matter. In the absence of extensive wetlands, bogs, or swamps, baseflow concentrations of DOC in undisturbed watersheds generally range from approximately 1 to 3 mg carbon/L. Higher concentrations suggest sources of organic pollution such as point sources from sewage treatment plant discharges or non-point-source runoff from urban or rural landscapes.
The biodegradable DOC fraction (BDOC) consists of organic molecules that heterotrophic bacteria can utilize as a source of energy and carbon. Within the context of drinking water quality, some subset of DOC constitutes the precursors of disinfection byproducts, and the BDOC constitutes the nutritional resources that can contribute to biological regrowth within water distribution systems.
For a complete description of all organic matter methodologies, data analyses, results, literature cited, and interpretations please see Chapter 6 in the final report.
Nitrogen, Phosphorus, and Dissolved Organic Carbon Spiraling
Phosphorus, nitrogen, and carbohydrates tend to be taken up and recycled several times as they move downstream. This cycling and the simultaneous downstream transport are sometimes referred to as “spiraling.” The “spiraling length” represents the distance over which the average nutrient atom travels as it completes one cycle of utilization from a dissolved available form, passes through one or more metabolic transformations and is returned to a dissolved available form.
Spiraling in the stream ecosystem reflects the degree of metabolic activity within the system, the ability of the system to retain nutrients, and the relative utilization rates (hence degree of nutrient limitation) among different nutrients. Spiraling length also describes the scale on which upstream processes are linked to downstream processes. Thus spiraling represents a fundamental measure of stream ecosystem function.
Ecosystem impairment is likely to increase spiraling length (reduce the cycling intensity) through reduced uptake, excessive loading, or decreased retentive ability of the ecosystem. An exception to this rule would occur when the increased loading of a single nutrient stimulates uptake of a second nutrient, whose spiraling length would shorten. Spiraling lengths of nitrogen, phosphorus and carbon (DOC) are estimated in the ten integrative stream sites under baseflow conditions.
For a complete description of all N, P, and DOC spiraling methodologies, data analyses, results, literature cited, and interpretations please see Chapter 8 in the final report.
Net Stream Metabolism
Stream metabolism was assessed concurrently with spiraling work (Task 6) at 10 integrative stream sites. Stream metabolism measurements provide data on two fundamental ecosystem functions – primary productivity and community respiration.
Gross primary productivity (GPP) is a measure of the rate of synthesis of plant (primarily algal) biomass, and respiration is an index of the breakdown of reduced chemical energy, including the metabolic costs of photosynthesis. These functional attributes are expected to relate principally to biomass of algae, heterotrophic microorganisms, and, to a lesser extent, macroinvertebrates. The actual rates are also influenced by environmental variables of light, temperature, and dissolved and particulate nutrients.
 Changes in activity, or in the balance of activity, over time would be an important signal that watershed activities are affecting function in a stream entering a reservoir, and would indicate a need for follow-up work on upstream tributaries.
For a complete description of all stream metabolism methodologies, data analyses, results, literature cited, and interpretations please see Chapter 9 in the final report.
Reservoir Primary Productivity
Measuring primary productivity in reservoirs allowed us to determine whether there is a link between the reservoirs and the primary tributaries to these reservoirs. If the major tributary to a reservoir contributes the most nutrients to the reservoir, we would expect that reservoirs would rank in the same order as tributaries with respect to metabolic activity. If they do not rank similarly, and the pattern was sustained over a period of years, we would infer that nutrients from other sources – or reservoir morphology or other physical characteristics – are more important regulators of metabolic activity than nutrients from the primary tributary. Just as for the influent streams, a change in activity over time will suggest that watershed changes are affecting processes in the system.
For a complete description of all primary productivity methodologies, data analyses, results, literature cited, and interpretations please see Chapter 10 in the final report.
Data
Publications
Primary productivity in receiving reservoirs: links to influent streams
Organic matter transport in New York City drinking-water-supply watersheds
Uptake of nutrients and organic C in streams in New York City drinking-water-supply watersheds
Molecular tracers of soot and sewage contamination in streams supplying New York City drinking water
Landscape template of New York City’s drinking-water-supply watersheds
Relating major ions and nutrients to watershed conditions across a mixed-use, water-supply watershed
Enhanced source-water monitoring for New York City: summary and perspective