Become Empowered and Energized Learning About Your Local Watershed!
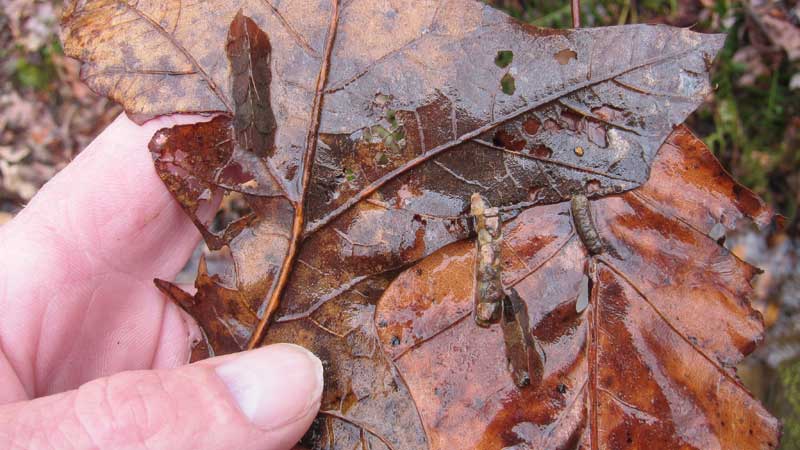
The Leaf Pack Network® is an international network of teachers, students, and citizen monitors investigating their local stream ecosystems. Following instructions in the Leaf Pack Network Manual, monitors use tree leaves and aquatic insects to determine the health of their stream and understand its ecology.

Step 1
Gather materials to conduct the study.

Step 2
Choose a stream that is safely accessible.


Step 4
Share your data on Monitor My Watershed!
Need More Information?
- Check the Resources page!
- Subscribe to the Leaf Pack Network e-newsletter to be notified about the latest news and events.
- Contact us for specific information on how to become involved or for the location of a workshop in your area.
-
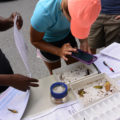
“Using the aquatic organisms, children can monitor the water quality in their local streams and compare their results with those of others.”
-
“I love that the Leaf Pack Network provides an authentic learning experience and exposes my students directly to the scientific process.”
-
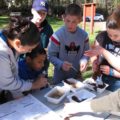
“Kids really love it when we take the leaf packs in and all of a sudden the bugs start moving. They really get into it. They get excited about science.”
-
“It’s amazing to watch students work with the leaf packs. They had no idea that those creatures lived there and could indicate their stream’s health.”
Leaf Pack Network News
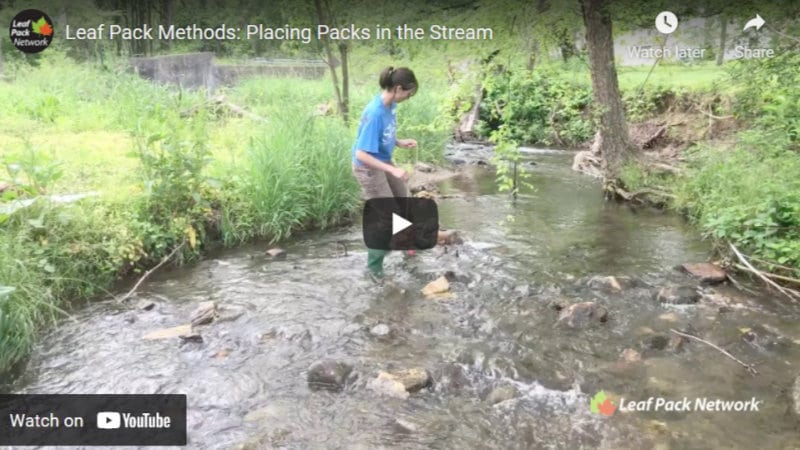
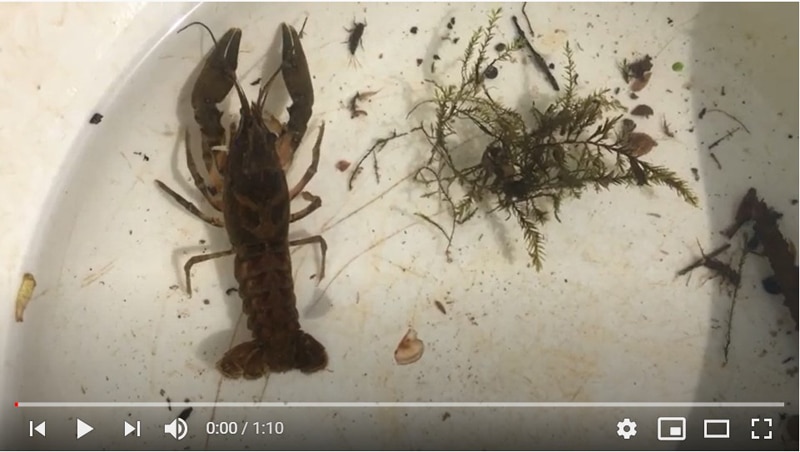
Grab Your Leaf Pack Network Manual and Follow Along With These Methods Videos
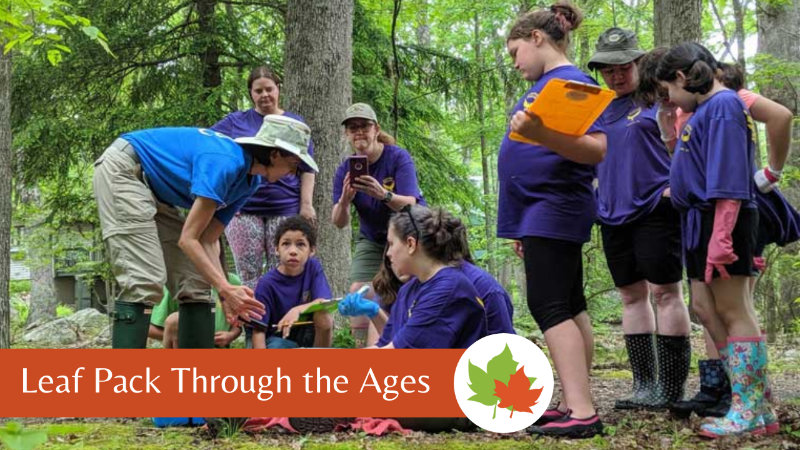
Leaf Pack Through the Ages: Monitoring With Students From Middle School to College
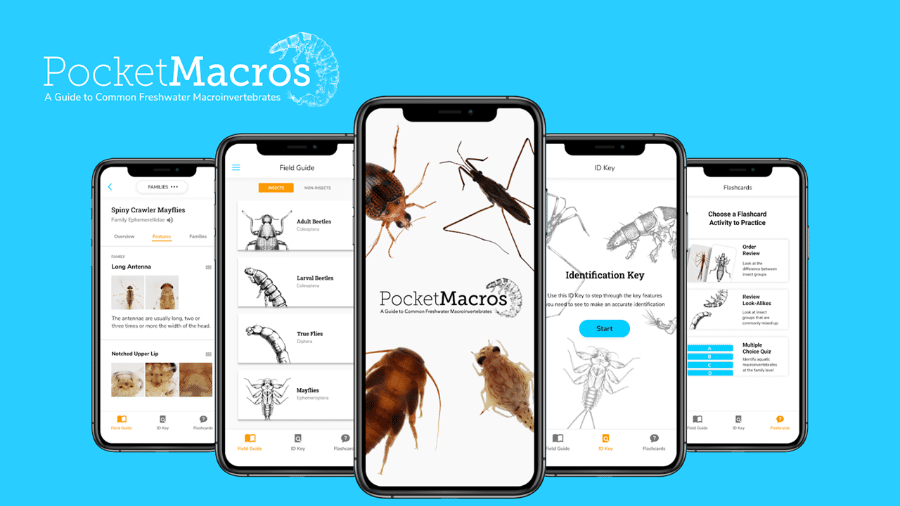
Dive Into PocketMacros, a Free Mobile App Version of Macroinvertebrates.org
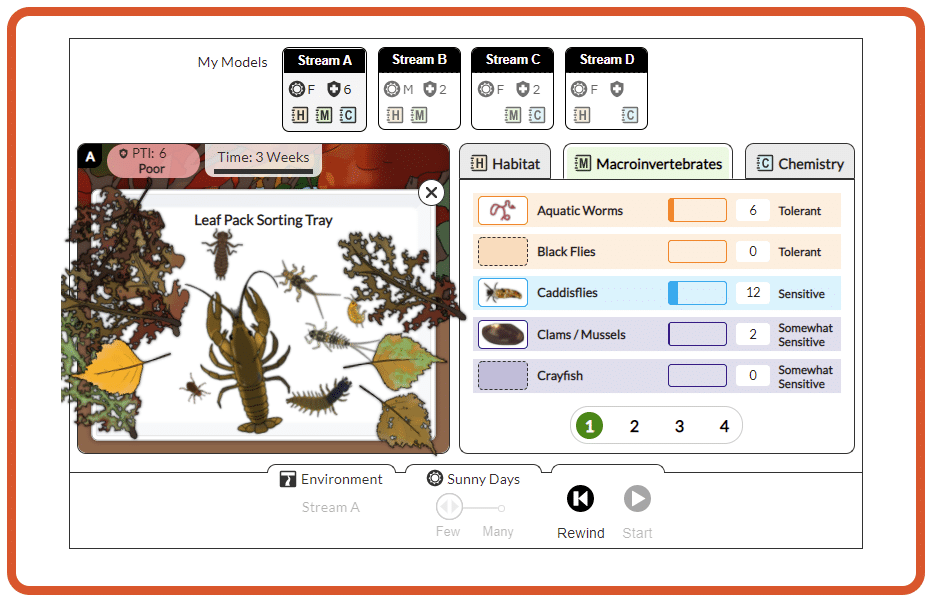
Introducing the Leaf Pack Network Simulation
Leaf Pack Network Adds Hands-On Experience to Virtual Learning